
Global EV Charging Infrastructure Market
The global EV charging infrastructure market is segmented by charger type (AC Charging and DC Charging), by power output (Below 7 kW, 7–22 kW, 23–50 kW, 51–150 kW, and Above 150 kW), by connector type (CCS1, CCS2, CHAdeMO, GB/T, Type 1 (J1772), Type 2 (Mennekes), NACS, and Others (LECCS, etc.)), by charging site (Private and Public), by propulsion (BEV, HEV, PHEV, FCEV), by vehicle type (Passenger Car and Commercial Vehicle), and by region (North America, Latin America, Europe, Asia-Pacific, and Middle-East and Africa). The global electric vehicle charging infrastructure market report includes market size in Value (USD) and forecast up to 2031.
Global EV Charging Infrastructure Market
Market Size in USD Billion
Market Size Overview
USD Billion
Market Snapshot
- Study Period
- 2019-2031
- Forecast Period
- 2026-2031
- Base Year Market Size (2025)
- USD 38.17 Billion
- Market Size (2026)
- USD 46.98 Billion
- Market Size (2031)
- USD 133.03 Billion
- Growth Rate (2026-2031)
- 23.14% CAGR
- Market Concentration
- Moderate
Major Players*





*Disclaimer: Major Players sorted in no particular order
Market Overview
The global EV charging infrastructure market value is anticipated to grow from USD 38.17 billion in 2025 to 46.98 million in 2026 and expected to reach USD 133.03 million in 2031 with a CAGR (2026-2031) of 23.14%.
The global EV charging infrastructure market is shifting from a hardware business toward integrated charging equipment, power management and software-enabled solutions. Electric-vehicle production, residential charging installation, public fast-charging EV stations requirements and the electrification of commercial fleets are the key attributes collectively driving the demand. Manufacturers are competing on charging speed, conversion efficiency, reliability, interoperability, installation flexibility and lifecycle service costs. Fragmented grid infrastructure readiness, high installation costs, uncertain charger utilization and distant connector regulations holds significant influence in EV charging equipment-purchasing decisions. Consequently, suppliers are emphasizing on modular platforms and scalable power architectures owing to accommodation of different vehicle types and operating environments.
Established electrical-equipment suppliers and specialist charging technology companies pursuing differentiated product strategies dominate the global EV charging infrastructure market. ABB E-mobility is expanding offering of modular, high-power systems for public charging and commercial fleets, while Siemens and Delta Electronics draw on their power-electronics expertise and extensive electrical infrastructure portfolios. Kempower is targeting distributed DC fast-charging systems, dynamic power allocation and megawatt charging for heavy-duty vehicles. Key players are combining hardware with remote monitoring, energy management, and maintenance and software services to deepen customer ties beyond the initial sale of equipment. Meanwhile, the following tier are vying in the market for compact residential chargers, manufacturing localization and cost optimization, while modular designs enable operators to ramp up capacity without overhauling systems.
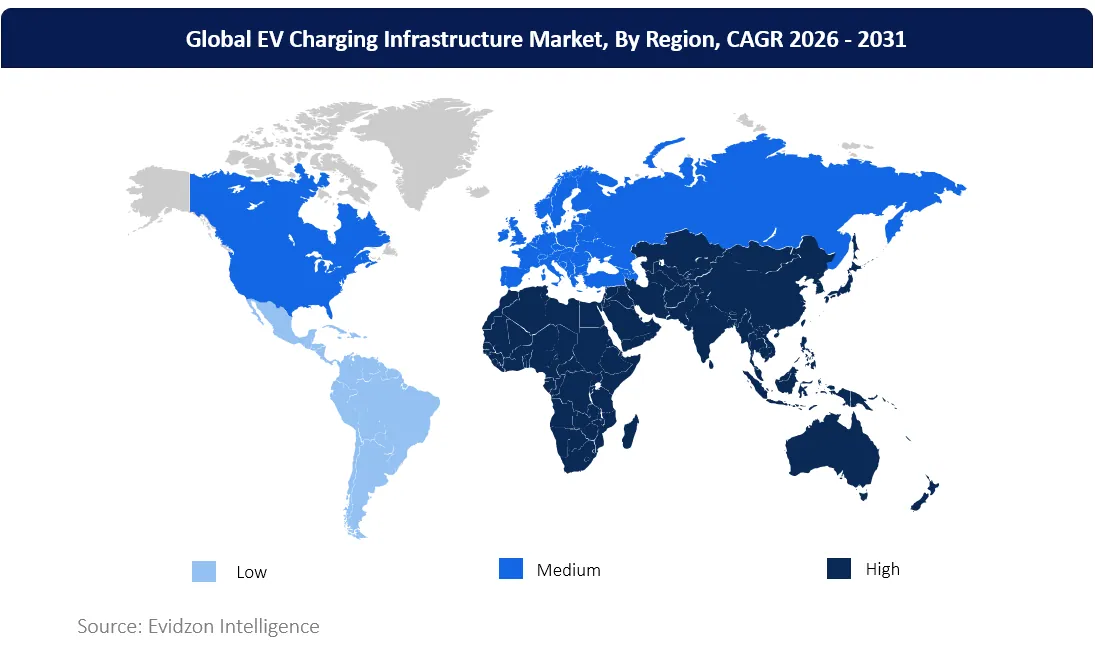
Asia-Pacific accounts the largest regional market in terms of installed charging infrastructure with China representing a significant share of global public charging points. The region’s extensive domestic production capabilities, large electric-vehicle fleet and ongoing infrastructure investments support Asia-Pacific dominance. Europe remains an attractive market driven by the need to expand public charging infrastructure in line with the EU Alternative Fuels Infrastructure Regulation that obliges fast-charging coverage on key transport corridors and sets minimum capacity requirements. North America presents opportunities in highway fast charging, fleet depot infrastructure and higher-powered equipment, although the implementation landscape is fragmented depending on funding and policy priorities.
Key Takeaways
- By charger type, DC charging accounts for nearly 56.8% market share in 2025 and expected to grow at a CAGR of 25.8% by 2031.
- By power output, 51–150 kW segment remains the largest sub-segment accounting for nearly 31.7% of the global EV charging infrastructure market in 2025. Whereas, above 150 kW is expected to be the fastest growing power output segment expanding at 29.6% CAGR by 2031.
- By connector type, GB/T segment has registered the highest market value share of nearly 35.6% in 2025 of global EV charging infrastructure market and NACS is expected to ride at a 31.2% CAGR over the forecast period.
- By charging site, private charging remains the dominant demand base with more than 59.3% market share in 2025, and public charging is projected to grow at 25.1% CAGR by 2031.
- By propulsion, battery electric vehicle (BEV) accounts for 83.6% global EV charging infrastructure market share in 2025. However, BEV is projected to witness a CAGR of 23.8% during 2026–2031.
- By vehicle type, passenger car segment accounts for nearly 86.9% market share in 2025. However, commercial vehicle is expected to grow at a CAGR of 28.4% by 2031.
- By region, Asia-Pacific accounts for 57.4% global EV charging infrastructure market share in 2025. However, Middle-East & Africa is projected to witness a CAGR of 30.2% during 2026–2031.
About the Study
The EV charging infrastructure market scope includes equipment employed to charge battery electric vehicles (BEVs) and plug-in hybrid electric vehicles (PHEVs), including AC and DC chargers, classified by power output and connector type. It includes private residential and workplace installations, as well as public fleet depots and commercial charging stations serving passenger cars, light commercial vehicles, trucks, buses and coaches. The scope of the study excludes standalone electric vehicles, batteries, electricity sales, battery-swapping systems, hydrogen refueling stations and grid infrastructure.
Market Dynamics Analysis
Drivers
Rising EV adoption expands requirements across charging locations.
Faster charging reduces waiting times and supports travel.
High-power chargers require more sophisticated power electronics.
Home charging offers convenience and lower operating costs.
Fleet operators require reliable, centralized charging capacity.
Connector compatibility broadens vehicle access across charging networks.
Restraints
Insufficient local capacity necessitates costly electrical upgrades.
Civil works and electrical upgrades increase upfront expenditure.
Low traffic reduces revenue relative to fixed costs.
Connector standards differences across increase interoperability and deployment complexity.
Increasing sales of electric vehicles is driving demand for charging infrastructure across residential, workplace, public and commercial locations. Convenient over-night charging, low charging cost in comparison to public EV charging infrastructure, and dedicated parking for charging are collectively fueling the private charging infrastructure in residential places. While, increasing investment in fast charging network is encouraging DC fast commercial charging stations owing to shorter stops and broader route coverage, resulting greater value per equipment installation. Moreover, depot charging station segment is growing on the back of increasing electric commercial vehicle adoption, as it offers charging capacity align with vehicle schedules and operating requirements. However, long-term growth is concentrated on connector standardization and compatibility by increasing utilization rate of charging stations allowing access to more vehicles.
Grid infrastructure readiness is one of the key attribute influencing the operations and deployment of electric vehicle charging station, when available electricity capacity is insufficient to accommodate the planned charging loads. Such locations require transformer upgrades, new connections and other electrical works, requiring long regulatory approvals leading to extend deployment and reduce utilization rate. Location with low grid infrastructure readiness led to hinder the installation economics due to increasing cost of civil works, cabling and electrical upgrades. The revenue from the chargers is insufficient in regions with low EV adoption rate or less plugged-in vehicles fleet, while the operating expenses (maintenance, site leasing, and electricity) will remain significant. Additionally, fragmented connector standardization complicate EV charging station deployment owing to compatibility across vehicle and charging networks.
Segment Analysis
By Charger Type
DC charging represents the largest charger type segment with 56.8% market share in global EV charging infrastructure market and expected to foresee 25.8% CAGR through 2031. DC charging infrastructure increasingly used to provide fast battery recharge at public charging stations, along highways and in commercial fleet facilities. Unlike AC chargers, DC systems convert electricity within the charging equipment so that higher charging powers can achieved and shorter charging sessions for compatible vehicles. Intercity travel and increasing BEV and PHEV adoption has led to drive demand owing to increasing need of charging convenience.
Investments in high power charging hubs are also driving equipment suppliers to develop more efficient power electronics, thermal management systems and modular architectures. However, the deployment economics are dependent upon the electricity connection capacity, utilization rates and installation requirements. As networks evolve, DC infrastructure will continue to be a key factor in enhancing accessibility, reducing downtime of charging and supporting larger battery pack vehicles.
EV Charging Infrastructure Market, By Charger Type, Market Share, 2025
By Power Output
51–150 kW accounts for the highest global EV charging infrastructure market share of 31.7% in 2025, meanwhile above 150 kW is projected to grow at 29.6% CAGR by 2031. The 51–150 kW power-output segment serves the largest range of electric vehicles across the globe in public charging stations, offering a balance in charging speed, equipment cost and electrical infrastructure requirements. Charging infrastructure in 51–150 kW power-output range is widely available across destination charging, urban public networks, and highway locations as it allows operators faster vehicle turnover. Primarily, growing BEV fleet, EV battery capacity, influences the demand curve and expansion of charging access. Grid connection costs, expected utilization and vehicle compatibility are the key concerns of charge point operators.
Meanwhile, chargers above 150 kW power-output segments are gaining traction across highway corridors, high-throughput charging hubs and commercial applications requiring shorter dwell times. Vehicle charging capabilities, site economics and the availability of suitable electrical capacity are the key factor led market mix by power-output.
EV Charging Infrastructure Market, By Power Output, Market Share, 2025
Geographic Analysis
Largest Region
Asia-Pacific registered the highest market share of 57.4% in 2025 of global EV charging infrastructure market. Asia-Pacific EV charging infrastructure market has a robust supply base supported by the region's extensive electric vehicle ecosystem, substantial domestic charger manufacturing capacity and sustained investment in public charging networks. Widespread EV adoption, deployment of urban charging facilities and expansion of high-power charging capabilities across China is supporting the Asia-Pacific EV charging infrastructure market.
Japan and South Korea also have well-established automotive industries, electrification programmes and technology development, while India and Southeast Asian markets present additional opportunities for growth as electric mobility gains ground in the region. Infrastructure requirements are highly variable across the region based on vehicle adoption, urban density, residential parking availability and electricity networks. Public charging infrastructure is of particular importance in areas where private charging access is limited while fleet depots represent another key source of demand for specialized installations.
EV Charging Infrastructure Market, By Region, Market Share, 2025
Fastest-Growing Region
Middle-East & Africa is projected to be the fastest region in global EV charging infrastructure market by 2031 accounting for 30.2% CAGR. The Middle-East and Africa EV charging infrastructure market is emerging as governments, utilities, building owners, and private firms promote the adoption of electric vehicles. Gulf countries are emphasizing on urban development initiatives and investment in public charging networks alongside broader transport electrification. Commercial centers, malls, hotels, and highway networks serve as potential EV charging infrastructure installation sites, while the need for fleet electrification drive the development of large-scale depot charging projects.
The development in Africa EV charging infrastructure market is comparatively fragmented in terms of EV adoption, grid readiness, vehicle affordability and charging infrastructure availability. Such factors limit the overall potential, moreover EV charging infrastructure development may see a strong uptick in several African countries, where EV adoption is growing. Demand will remain driven by the rising adoption of electric vehicles, the extent of private investment, the availability of reliable electricity, the choice of charging infrastructure, and the value proposition.
Competitive Landscape
- 1ABB E-mobility B.V.
- 2Delta Electronics, Inc.
- 3Siemens AG
- 4Schneider Electric SE
- 5ChargePoint Holdings, Inc.
Market Concentration Level: Moderate
The global EV charging infrastructure market competitive landscape is moderately concentrated, ABB E-mobility B.V., Delta Electronics Inc., Siemens AG, Schneider Electric SE, and ChargePoint Holdings, Inc. are the key players owing to established expertise in electrical equipment, power conversion and energy management. While specialist suppliers like ChargePoint Holdings, Inc. and Wallbox N.V. is emphasizing offering to resolve specific charging problems, Such as through charging hardware and network-management software ChargePoint takes a broader approach while Wallbox serves residential and commercial applications.
The competitive difference is in the sale of charging equipment versus the provision of an infrastructure that proves reliability during its lifetime. While the cost of hardware is crucial to buyers, as power capabilities, interoperability, remote diagnostic tools, maintenance, grid constraints and overall cost are the key evaluation factors. Fleet owners may more concern with power management and uptime while homeowners will buy cost-effective and simple installation. Meanwhile, public charging station operators will focused on volumes and reliability of the network services provided.
Recent Development
ChargePoint Launches 600 kW Fast Charger
ChargePoint announced Express Solo , a DC fast charger that can support up to 600 kW for a single vehicle or be distributed amongst multiple cars. The Eaton DC fast charger offers bidirectional charging, battery storage, and deployment in North America and Europe.
Servotech Wins DC Charger Supply Orders
Servotech Renewable Power System received orders for 423 DC fast chargers worth Rs 59.98 crore (USD 5.88 million). The company has booked 67% of the total 631 DC fast chargers tendered by state-owned entities and oil marketing companies. The 423 DC fast chargers are expected to be commissioned during FY2026. The chargers would include 60 kW and 120 kW variants.
Exicom Opens New Charger Manufacturing Facility
Exicom commenced operations at its new manufacturing facility in Hyderabad after investing around USD 24 million in the project. The manufacturing facility is spread in 18.4-acre to scale EV charging solutions, critical power products, and doubling the production capacity, led Exicom to become the second-largest EV charging station manufacturer across the world.
Table of Content
- 1.Introduction
- 1.1Scope and Objective of the Study
- 1.2Market Definition & Study Assumptions
- 2.Research Methodology
- 3.Executive Summary
- 4.Market Outlook
- 4.1Market Overview
- 4.2Market Drivers
- 4.2.1Expanding Electric Vehicle Fleets Increase Charging Demand
- 4.2.2Public Fast-Charging Networks Attract Infrastructure Investment
- 4.2.3Higher Charging Power Increases Equipment Value
- 4.2.4Residential Charging Adoption Strengthens Private Installations
- 4.2.5Commercial Fleet Electrification Accelerates Depot-Charging Deployment
- 4.2.6Charging Standardization Improves Network Compatibility and Utilization
- 4.3Market Restraint
- 4.3.1Grid Connection Constraints Delay Charging Infrastructure Deployment
- 4.3.2High Installation Costs Weaken Charging Project Economics
- 4.3.3Uneven Charger Utilization Delays Investment Payback
- 4.3.4Connector Fragmentation Complicates Cross-Network Charging Compatibility
- 4.4Regulatory Landscape
- 4.5Supply/Value Chain Analysis
- 4.6Porter's Five Forces Analysis
- 4.6.1Threat of New Entrants
- 4.6.2Bargaining Power of Buyers
- 4.6.3Bargaining Power of Suppliers
- 4.6.4Threat of Substitutes
- 4.6.5Competitive Rivalry
- 5.Market Segmentation (Includes market size in Value (USD), Forecast up to 2031, and market analysis with growth attributes)
- 5.1By Charger Type
- 5.1.1AC Charging
- 5.1.2DC Charging
- 5.2By Power Output
- 5.2.1Below 7 kW
- 5.2.27–22 kW
- 5.2.323–50 kW
- 5.2.451–150 kW
- 5.2.5Above 150 kW
- 5.3By Connector Type
- 5.3.1CCS1
- 5.3.2CCS2
- 5.3.3CHAdeMO
- 5.3.4GB/T
- 5.3.5Type 1 (J1772)
- 5.3.6Type 2 (Mennekes)
- 5.3.7NACS
- 5.3.8Others (LECCS, etc.)
- 5.4By Charging Site
- 5.4.1Private
- 5.4.1.1Residential (Private House and Apartments)
- 5.4.1.2Workplace
- 5.4.2Public
- 5.4.2.1Fleet Depot
- 5.4.2.2Commercial Charging Station
- 5.5By Propulsion
- 5.5.1Battery Electric Vehicle (BEV)
- 5.5.2Plug-in Hybrid Electric Vehicle (PHEV)
- 5.6By Vehicle Type
- 5.6.1Passenger Car
- 5.6.1.1Hatchback
- 5.6.1.2Sedan
- 5.6.1.3SUV / MUV
- 5.6.2Commercial Vehicle
- 5.6.2.1Light Commercial Vehicle
- 5.6.2.2Medium and Heavy-Duty Trucks
- 5.6.2.3Bus and Coach
- 5.7By Region
- 5.7.1North America
- 5.7.1.1United States
- 5.7.1.2Canada
- 5.7.2Latin America
- 5.7.2.1Brazil
- 5.7.2.2Argentina
- 5.7.2.3Mexico
- 5.7.2.4Rest of Latin America
- 5.7.3Europe
- 5.7.3.1Germany
- 5.7.3.2Italy
- 5.7.3.3France
- 5.7.3.4Spain
- 5.7.3.5United Kingdom
- 5.7.3.6Russia
- 5.7.3.7Rest of Europe
- 5.7.4Asia Pacific
- 5.7.4.1China
- 5.7.4.2India
- 5.7.4.3Japan
- 5.7.4.4South Korea
- 5.7.4.5Indonesia
- 5.7.4.6Australia
- 5.7.4.7Rest of Asia-Pacific
- 5.7.5Middle East & Africa
- 5.7.5.1Saudi Arabia
- 5.7.5.2United Arab Emirates (UAE)
- 5.7.5.3South Africa
- 5.7.5.4Egypt
- 5.7.5.5Rest of the Middle East & Africa
- 6.Competitive Landscape
- 6.1Market Concentration Overview
- 6.2Market Share Analysis
- 6.3Company Profiles
- 6.3.1ABB E-mobility B.V.
- 6.3.2Delta Electronics, Inc.
- 6.3.3Siemens AG
- 6.3.4Schneider Electric SE
- 6.3.5ChargePoint Holdings, Inc.
- 6.3.6Tesla, Inc.
- 6.3.7Eaton Corporation plc
- 6.3.8Huawei Technologies Co., Ltd.
- 6.3.9Blink Charging Co.
- 6.3.10Circontrol, S.A.
- 6.3.11Alfen N.V.
- 6.3.12Leviton Manufacturing Co., Inc.
- 6.3.13Webasto SE
- 6.3.14Autel Intelligent Technology Corp., Ltd.
- 6.3.15Wallbox N.V.
- 7.Future Outlook
- 7.1Growth Opportunities & White-Space Analysis
- 7.2Analyst Recommendations
Market Size Methodology
The global EV charging infrastructure market size is derived by multiplying annual deployed charging units by respective ASP (average selling price). The market size is estimated for different charger types, power, connector types, charging sites, vehicle propulsions, vehicle types, and regions. The average selling prices of the chargers are determined by capacity, AC/DC type, connector, and installation needs.
The estimates are based on the number of installed charging stations, government, public tenders, suppliers, companies, project approvals, and operators’ data on the charging network. The market projections are determined by EV sales, charging-point installations, public and private investments, government incentives, emission regulations, charging network developments, and residential, workplace, commercial, and fleet-depot installations across regions and countries.
FAQ
What is the projected size of the global EV charging infrastructure market by 2031?
The global EV charging infrastructure market is projected to reach USD 133.03 billion by 2031, growing from USD 38.17 billion in 2025 at a CAGR of 23.14% during 2026–2031.
Which charger type holds the largest market share?
DC charging holds the largest share, accounting for 56.8% of the global EV charging infrastructure market in 2025.
Which power output segment dominates the market?
The 51–150 kW segment holds the largest share, accounting for 31.7% of the global market in 2025.
Which region dominates the global EV charging infrastructure market?
Asia-Pacific dominates the market, accounting for 57.4% of global market value in 2025, supported by electric vehicle adoption, domestic charger manufacturing capacity, and investment in public charging networks.
Who are the key players in the global EV charging infrastructure market?
ABB E-mobility B.V., Delta Electronics, Inc., Siemens AG, Schneider Electric SE, and ChargePoint Holdings, Inc. identified as the five major players. These companies compete through charging equipment, power conversion, energy management, and related charging solutions.
Have a question about this report?
Talk to the analyst behind this research, or browse the full report catalogue.
Contact Us